Figure 1.

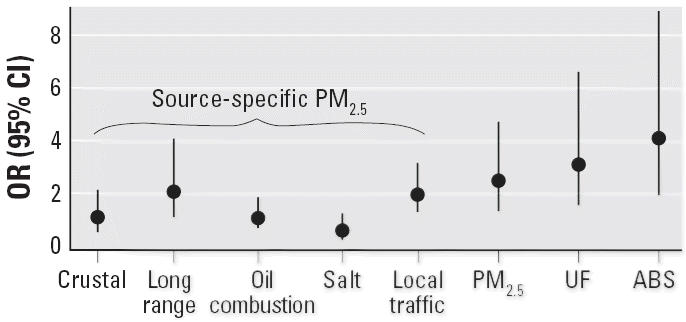
ORs and 95% CIs for 2-day lag for the association of source-specific PM2.5, (total) PM2.5, UF, and PM2.5 ABS with the occurrence of ST segment depressions > 0.1 mV. ORs were calculated for an increase of interquartile range of pollutant.

ORs and 95% CIs for 2-day lag for the association of source-specific PM2.5, (total) PM2.5, UF, and PM2.5 ABS with the occurrence of ST segment depressions > 0.1 mV. ORs were calculated for an increase of interquartile range of pollutant.