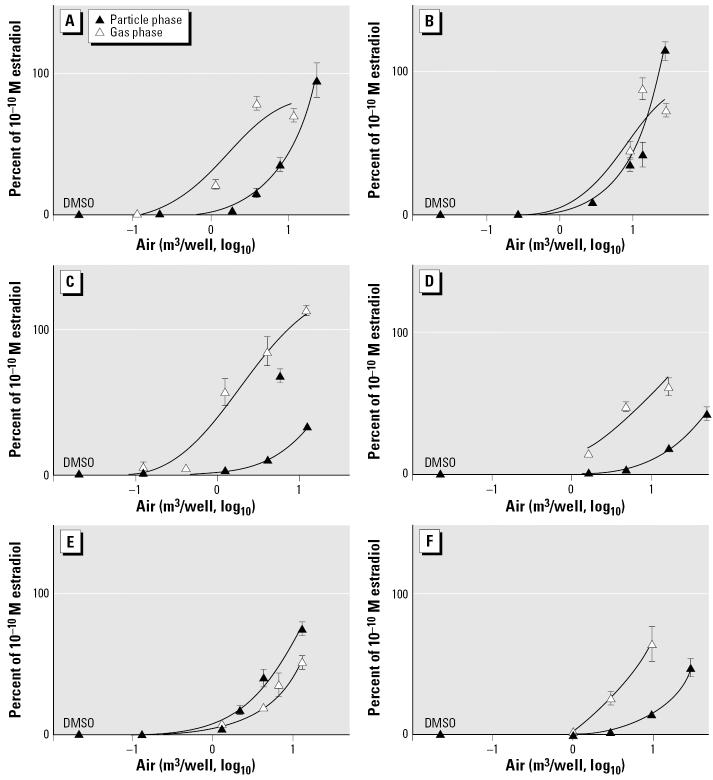
Figure 4.
Dose–response curves for ER-responsive cells treated with varying concentrations of air extracts (m3 air/well) of gas-phase and particulate-phase ambient air samples. (A) Urban sample, March 2000. (B) Urban sample, March 2001. (C) Urban sample, July 2000. (D) Urban sample, July 2001. (E) Rural sample, July 2000. (F) Rural sample, July 2001. Activity is expressed as percentage of the response to 10−10 M estradiol. Data represent mean ± SD from three separate experiments. Dose–response curves were generated using GraphPad Prism software.

