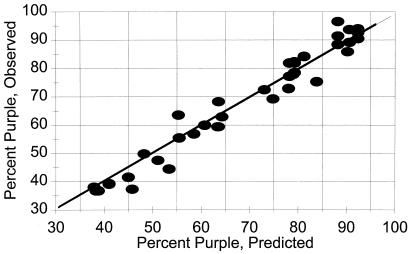
Figure 7.
Shifts in i.p. reflect fractional conversion of blue to purple compound. Data are from various experiments in which the i.p. was shown to vary from 603 to 573 nm. Observed values represent the fraction of blue compound converted to the purple compound as calculated from spectral changes by using Eqs. 1 and 2. Predicted values represent the values deduced from simulation studies showing that the i.p. may reflect the fraction of blue to purple conversion.

