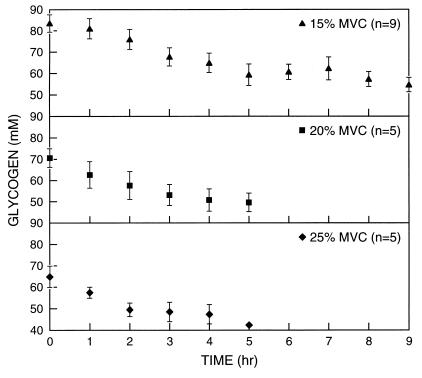
Figure 2.
Gastrocnemius glycogen concentration vs. exercise time for low-intensity exercise from rest at 15, 20, and 25% of maximal voluntary contraction (MVC). Values are means ± SE [reproduced with permission from ref. 11 (Copyright 1991, The American Physiological Society)].

