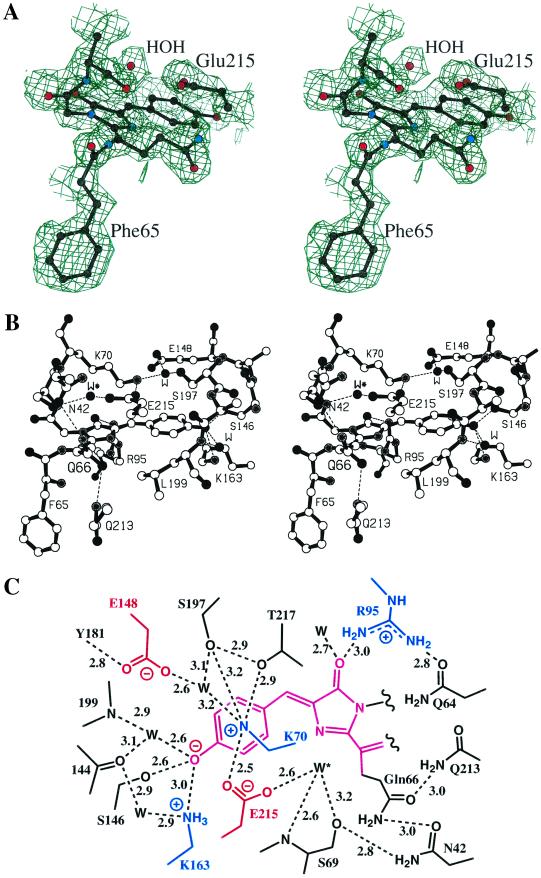
Figure 3.
(A) A portion of the experimental multiwavelength anomalous dispersion-phased electron density map at 2.0-Å resolution, contoured at 1.0 standard deviation. The refined model of the chromophore and some surrounding side chains are superimposed. (B) Ball-and-stick diagram of the DsRed chromophore and environment. Some important salt bridges and/or hydrogen bonds are indicated by dashed lines. (C) Schematic diagram of the chromophore environment showing salt bridges and/or hydrogen bonds (dashed), labeled with approximate lengths in angstroms. Charged residues in the vicinity of the chromophore are colored, and a proposed catalytic water molecule is indicated by W* (see text).

