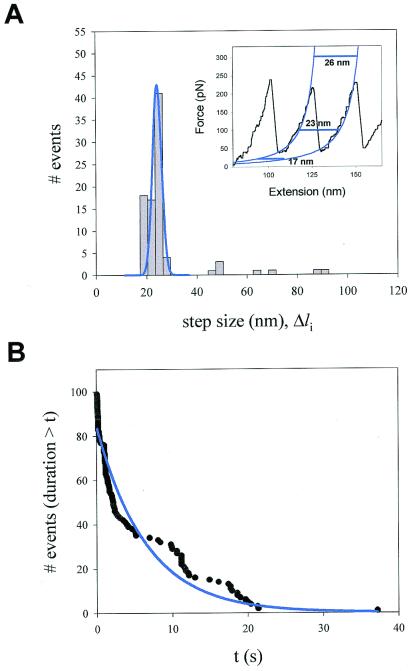
Figure 4.
Analysis of the step sizes and dwell times of unfolding events recorded at constant force. (A) Frequency histogram of step sizes for the I2712 polyprotein (n = 99) shows a principal peak centered at 22.4 nm and three additional minor peaks that average 48.1, 67.3, and 89.1 nm. The data were obtained from 16 different experiments at an average force of 147 pN. (Inset) Fits (blue lines) of the worm-like chain (Eq. 1) to a sawtooth pattern of an I2712 polyprotein. The horizontal lines illustrate the expected length increase caused by domain unfolding at various forces. (B) Probability distribution function showing the probability that after applying force, a module remains folded for a time equal or less than t. The distribution was fit by a single exponential function with a time constant τ = 6.7 s (solid line).

