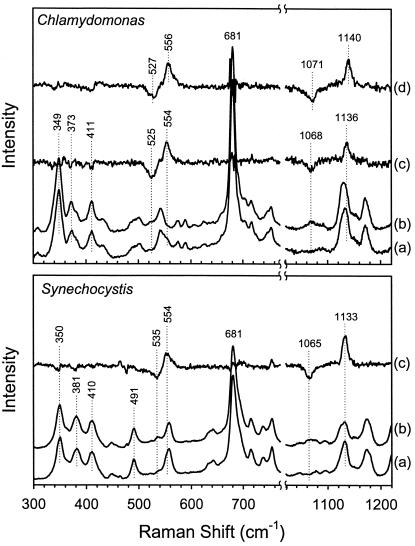
Figure 1.
Assignment of the frequencies of the O—O and Fe—O2 stretching modes in the resonance Raman spectra of Chlamydomonas and Synechocystis oxyhemoglobins. Spectra shown are (a) 16O2 in H2O, (b) 18O2 in H2O, and (c) the 16O2 − 18O2 difference spectrum in H2O. The 16O2 − 18O2 difference spectrum for the oxy complex of K(E10)A mutant of Chlamydomonas is shown in (d). The values of νFe—O2 and νO—O are, respectively, 1136 (1068 with 18O2) and 554 (525) cm−1, for wild-type Chlamydomonas Hb; 1140 (1071) and 556 (527) cm−1 for the K(E10)A mutant of Chlamydomonas Hb; and 1133 (1065) and 554 (535) cm−1 for wild-type Synechocystis Hb.

