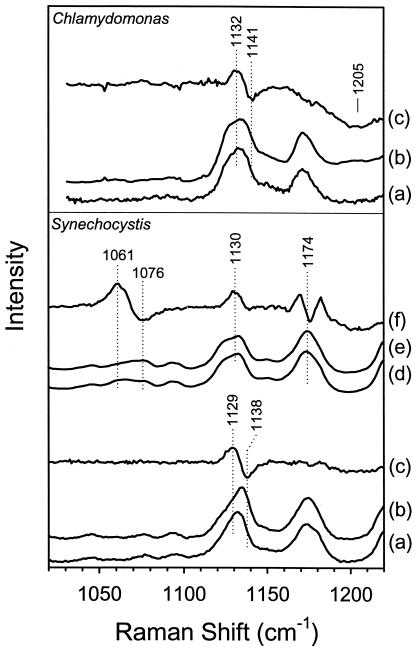
Figure 2.
The H/D sensitivity of the frequency of the O—O stretching mode in the resonance Raman spectra of Chlamydomonas and Synechocystis oxyhemoglobins. Spectra shown are (a) 16O2 in H2O, (b) 16O2 in D2O, and (c) the H2O − D2O difference spectrum for 16O2. The sensitivity of the νO—O mode to H2O/D2O is seen in the difference line at 1132/1141 cm−1 for Chlamydomonas HbO2, and at 1129/1138 cm−1 for Synechocystis HbO2. The broad line at ≈1205 cm−1 results from the D—O—D bending vibration of D2O. Also shown, for Synechocystis oxyHb, are (d) 18O2 in H2O, (e) 18O2 in D2O, and (f) the H2O − D2O difference spectrum for 18O2, which shows a difference feature at 1061/1076 cm−1.

