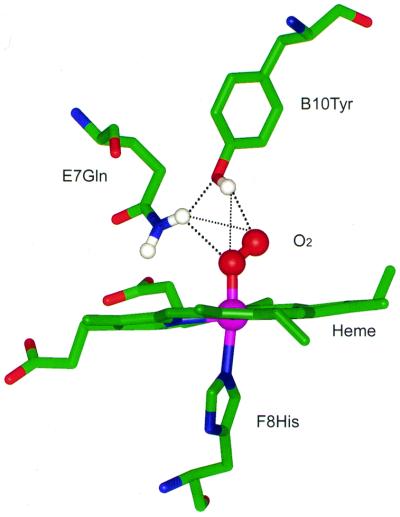
Figure 4.
Proposed structural model of the active site in Chlamydomonas and Synechocystis HbO2. Only selective residues in the vicinity of the heme are shown. The model was built by using the structural coordinates of HbO2 of Ascaris suum (1ash.pdb, Brookhaven Protein Data Bank). The dotted lines represent hydrogen bonds (thick line, strong hydrogen bond; thin line, weak hydrogen bond). The E10 helical positions (not shown here) are occupied by a Lys and a His, respectively, in Chlamydomonas and Synechocystis Hb.

