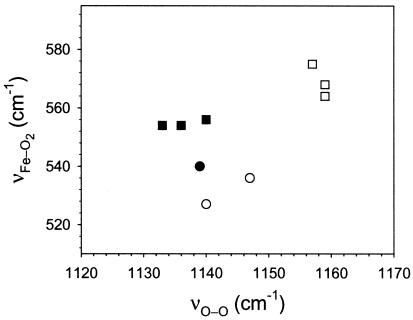
Figure 5.
A plot of the frequencies of the νFe—O2 vs. νO—O modes for the oxy complexes of hemeproteins and heme model compounds containing histidine as the proximal ligand. The frequencies are listed in Table 1. Chlamydomonas and Synechocystis Hb (filled square), six-coordinate heme model complexes (open square), Cytochrome P450 (filled circle), and 6-coordinate model heme complexes containing S−-ligation on the proximal side (open circle). No correlation between the frequencies of the νFe—O2 and νO—O modes is apparent from this plot.

