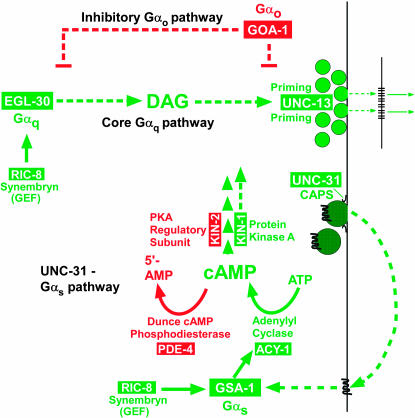
Figure 3.
Schematic of the C. elegans synaptic signaling network with emphasis on the Gαs pathway. Shown are the three major Gα-signaling pathways of the network with the Gαo and Gαq branches of the network in skeletal form (most components not shown). Solid lines indicate that direct interactions are known or likely, while dashed lines indicate predicted interactions, unknown components, or known components that are not shown. Proteins that promote locomotion and/or neurotransmitter release are shown in green, while proteins that inhibit locomotion and/or neurotransmitter release are shown in red. The model is based on findings from this study (for PDE-4) and the following previous studies: Maruyama and Brenner (1991), Mendel et al. (1995), Segalat et al. (1995), Brundage et al. (1996), Korswagen et al. (1997), Berger et al. (1998), Hajdu-Cronin et al. (1999), Lackner et al. (1999), Miller et al. (1999, 2000), Nurrish et al. (1999), Richmond et al. (1999, 2001), Moorman and Plasterk (2002), Tall et al. (2003), Reynolds et al. (2005), Schade et al. (2005), and Charlie et al. (2006).

