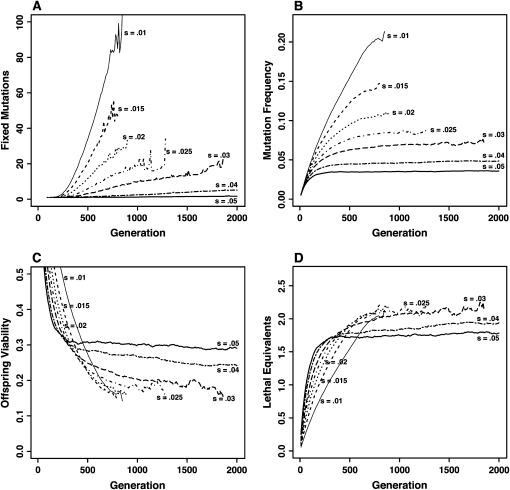
Figure 2.
Deleterious mutation dynamics for mildly deleterious (s = 0.01–0.05) and partially recessive (h = 0.3) mutations. (A) Number of fixed deleterious mutations in the whole population. (B) Frequency of the mutations in the population. (C) Mean offspring viability. (D) Mean number of lethal equivalents. Parameters are: nd = 10 demes, N = 10, c = 0.2, mean fecundity f = 20, and U = 1. Mutations with effect s < 0.04 caused the mutational meltdown of the populations before 2000 generations, as shown by the interrupted lines.

