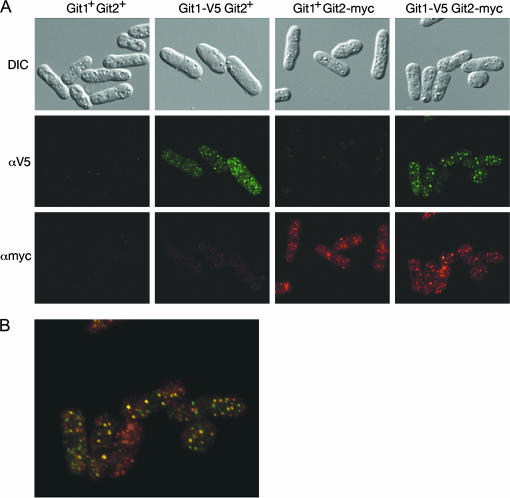
Figure 9.
Partial colocalization of Git1 and Git2. (A) DIC and fluorescent images of cells expressing tagged and untagged forms of Git1 and Git2 (adenylate cyclase) as indicated. Fluorescent images were taken with the same exposure time for each sample. (B) Merged fluorescent image from A of cells expressing Git1-V5 and Git2-myc.

