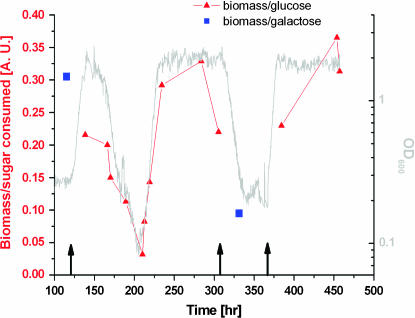
Figure 3.
The biomass per sugar (glucose, red; galactose, blue) consumed during adaptive dynamics in the chemostat for the same experiment as in Figure 2. The sugar concentrations in the chemostat were measured at different time points along the adaptation process following medium switches: galactose to glucose (left arrow), glucose to galactose (middle arrow), and galactose to glucose (right arrow). Throughout the experiment, the sugar consumed by the cells is at most 25% of the amount fed into the chemostat (2%) so sugar (either glucose or galactose) is always in large excess. Samples harvested from the chemostat at different time points were centrifuged and the supernatant was separated. Sugar concentration was measured using the d-glucose or lactose/d-galactose kit according to the manufacturer's instructions (Scil Diagnostics, Martinsried, Germany). The results shown are the average over duplicate measurements with maximal error of 7%. The sugar consumed is the difference between the measured sugar concentration in the feeding medium and that in the chemostat. The measured OD (proportional to cell density in the chemostat, plotted in gray) divided by the sugar consumed is plotted. The cell density (OD) in the chemostat is determined by the ability of the cells to convert limiting nutrient to biomass (yield with respect to limiting nutrient). This, in turn, is determined by the overall cell metabolism, in particular sugar consumption. Thus, changes in OD in the chemostat largely reflect changes in metabolic yield of the cells.

