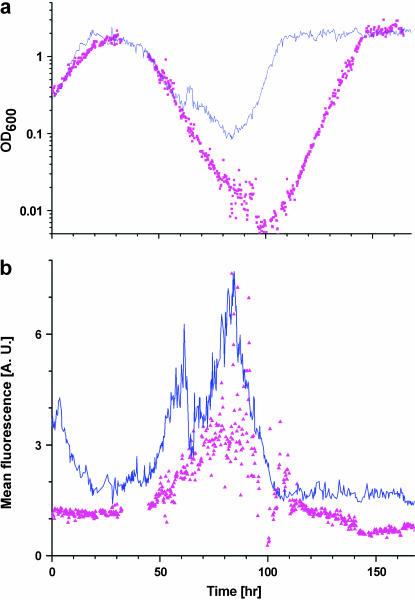
Figure 4.
Repetition of population dynamics in separate experiments. The same experiment as in Figure 2 was repeated to distinguish between robust features and specific history-dependent ones. The blue curves are the results of the experiment in Figure 2 and the magenta points are the repeated experiment under the same conditions. (a) OD and (b) mean fluorescence level of the populations of cells in the chemostat are shown. The medium was switched from galactose to glucose at t = 0. The initial exponential decay of the population, the exponential increase in the density of the adapted population, and the final OD steady-state level are all robust features of the dynamics, while the exact turning point of OD and adaptation time depend on history. The fluorescence signal shows robust bursts of activity during adaptation in the decay phase.

