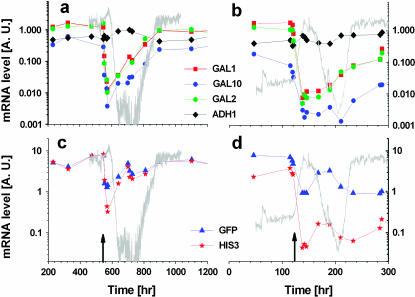
Figure 9.
mRNA levels during adaptation. Real-time PCR was used to quantify the mRNA expression level as a function of time, for the two chemostat experiments switching from galactose to glucose (Figures 2 and 6). The structural GAL genes and ADH1 control, for (a) 40 mm 3AT and (b) no 3AT. gfp and HIS3 and for (c) 40 mm 3AT and (d) no 3AT are shown. All mRNA levels are relative to the level of ACT1 in the same sample. Note the logarithmic scale. The gray traces in the background depict the OD levels in the chemostat and the arrows mark the time of switching from galactose to glucose.

