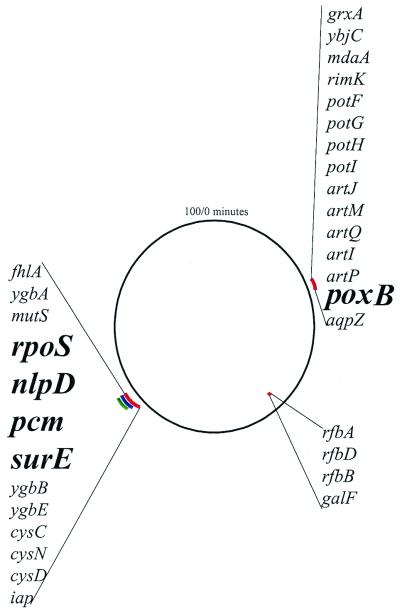
Figure 4.
Genes present in the regions of genome reorganization. The circle represents the E. coli chromosome. Lines outside of the circle represent regions of duplication, and lines inside the circle represent regions of deletion. Red lines are reorganization events in the 42+1 line, the blue line represents the duplication in the 42−1 line, and the green line represents the duplication in the 42−2 line. ORFs of known function are listed for each duplication or deletion. (For a complete list of ORFs for each duplication and deletion, see supplemental text.)

