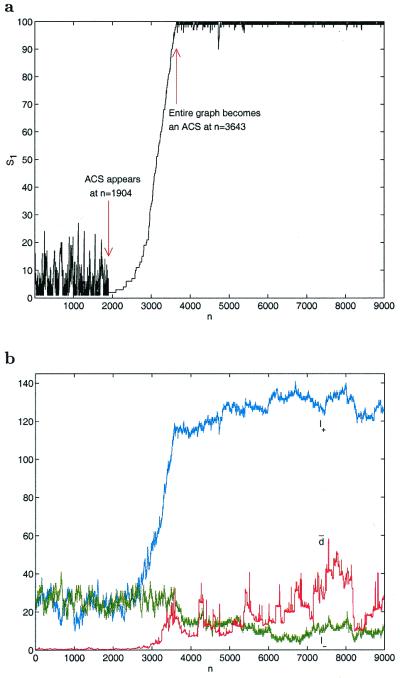
Figure 1.
A run with parameter values s = 100, p = 0.005, and x0 = 10−4. (a) Number of populated species, s1, in the attractor of Eq. 1 (i.e., number of nodes with Xi > 0) after the nth addition of a new species (i.e., after n graph update time steps). (b) The number, l+, of positive links (cij > 0) in the graph (blue); the number, l−, of negative links (green); and “interdependency,” d̄, of the species in the network (red). The curves have three distinct regions. Initially s1 is small; most of the species have zero relative populations. l+ and l− also do not vary much from their initial (random graph) value (≈ps2/2 = 25) and remain approximately equal. d̄ hovers about its initial low value. In the second region s1, l+ and d̄ show a sharp increase, and l− decreases. In the third region s1, l+ and d̄ level off (but with fluctuations), and almost all species have nonzero populations in contrast to the initial period.

