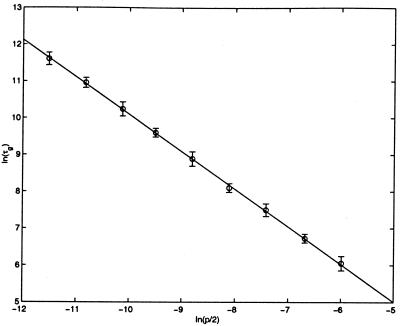
Figure 2.
Power law dependence of τg on p. Each data point shows the average of τg over 5 different runs with s = 100 and the given p value. The error bars correspond to one standard deviation. The best fit line has slope −1.02 ± 0.03 and intercept −0.08 ± 0.26, which is consistent with the expected slope −1 and intercept 0.

