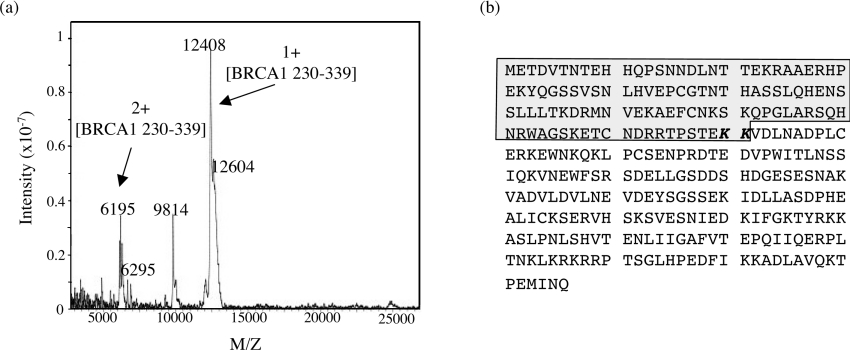
Figure 3. Mapping of the major proteolytic fragments of BRCA1-(230–534), resulting from limited trypsinolysis, by MALDI-TOF.
(a) Mass spectrum of peak 62. The heterogeneity observed in the peaks is due to cleavage at two adjacent lysine residues and a proportion of the sample retaining the N-terminal methionine. (b) The amino acid sequence of BRCA1-(230–534). The highlighted region was identified as a domain produced from limited trypsinolysis. This region has a calculated molecular mass of 12556 Da and thus domain boundaries are identified as residues 230–339.

