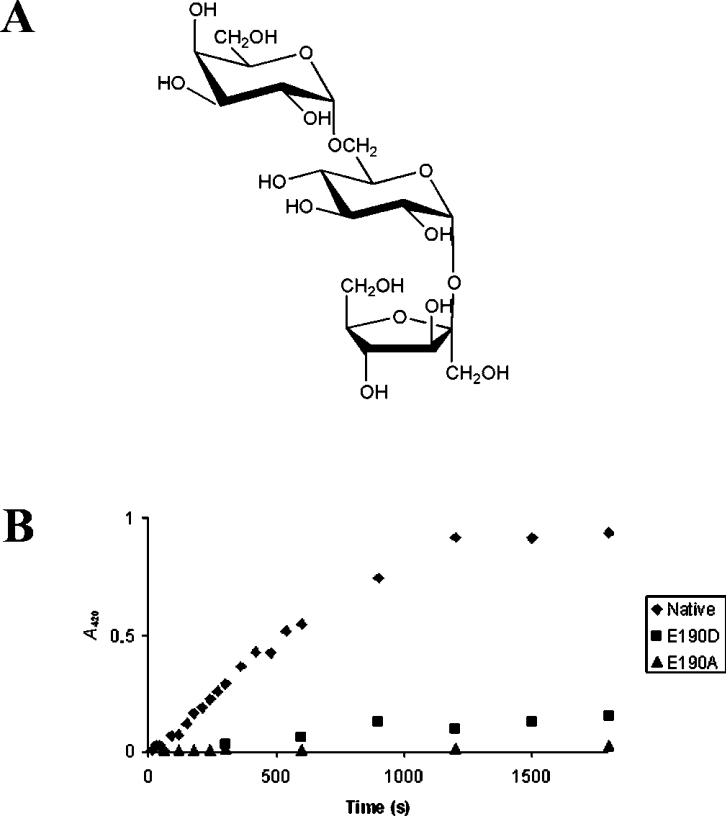
Figure 1. (A) Schematic representation of the substrate molecule α-D-galactopyranosyl-(1,6)-α-D-glucopyranosyl-β-D-fructofuranoside (raffinose). (B) Comparison of the activity between native invertase (◆) with mutants’ inv-E190D (■) and inv-E190A (▲).
Glucose release after sucrose hydrolysis was assayed by the colorimetric reaction of the reducing ends with ferricyanide. The activity was monitored by the decrease in A420 as a function of time (scale in seconds).

