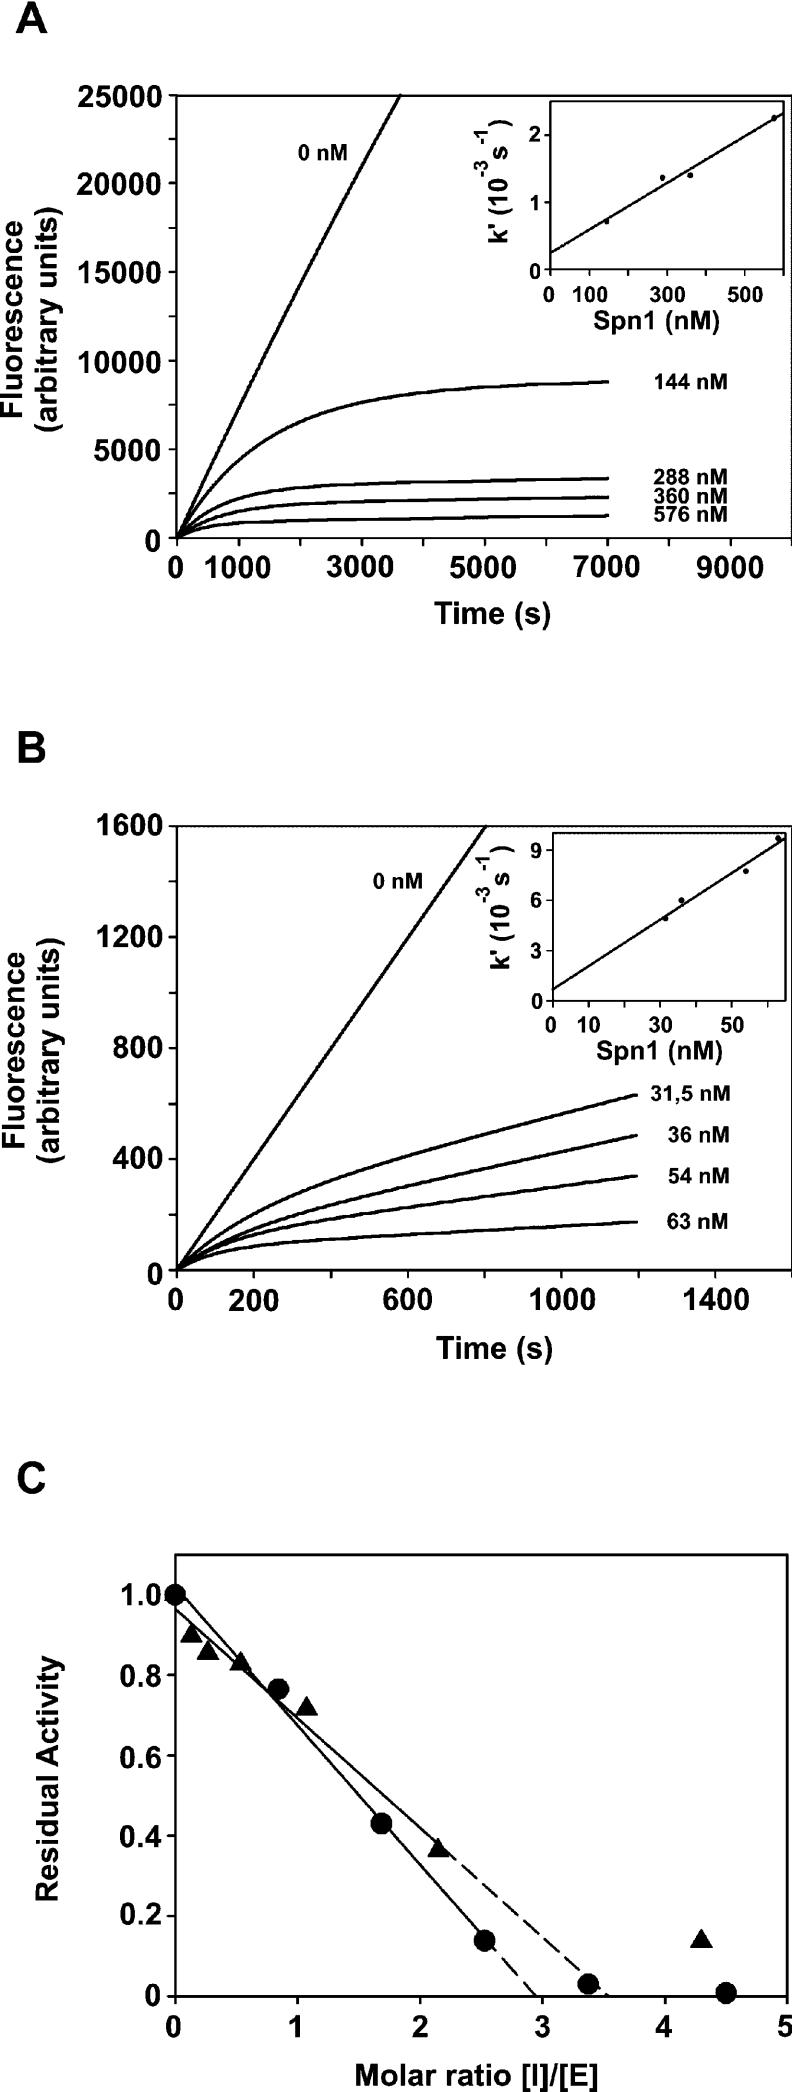
Figure 4. Progress curves for inhibition of PCs by Spn1 and SI.
Human furin (2 nM) or mPC1/3 (2.5 nM) was added to a mixture consisting of the fluorogenic substrate pERTKR-AMC and different concentrations of Spn1. Residual enzyme activities were determined by measuring the change of fluorescence resulting from cleavage of the substrate at pH 7.5 by furin (A) or at pH 6.0 by mPC1/3 (B) respectively. The insets show that k′ depends linearly on the inhibitor concentration. The SI values (C) for interaction of Spn1 with dec-RVKR-cmk-titrated furin (●-●) or mPC1/3 (▲-▲) were determined by incubation of the enzymes with increasing amounts of the inhibitors. The residual enzyme activities were measured and the SI values were determined by linear regression analysis to extrapolate the Spn1/enzyme ratio that resulted in complete inhibition.

