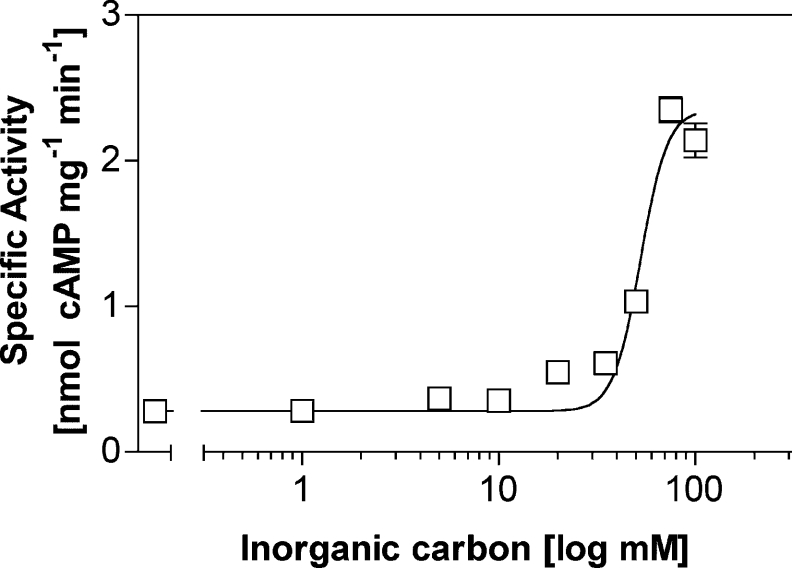
Figure 2. Response of wild-type Slr1991120–337 to Ci.
Slr1991120–337 specific activity (n=6) was plotted against increasing total Ci (‘inorganic carbon’). The assay mixture contained 1.5 μM protein and 20 μM Mn2+-ATP, pH 6.5, with Na+ as cation. The total salt concentration was adjusted to 200 mM with NaCl.

