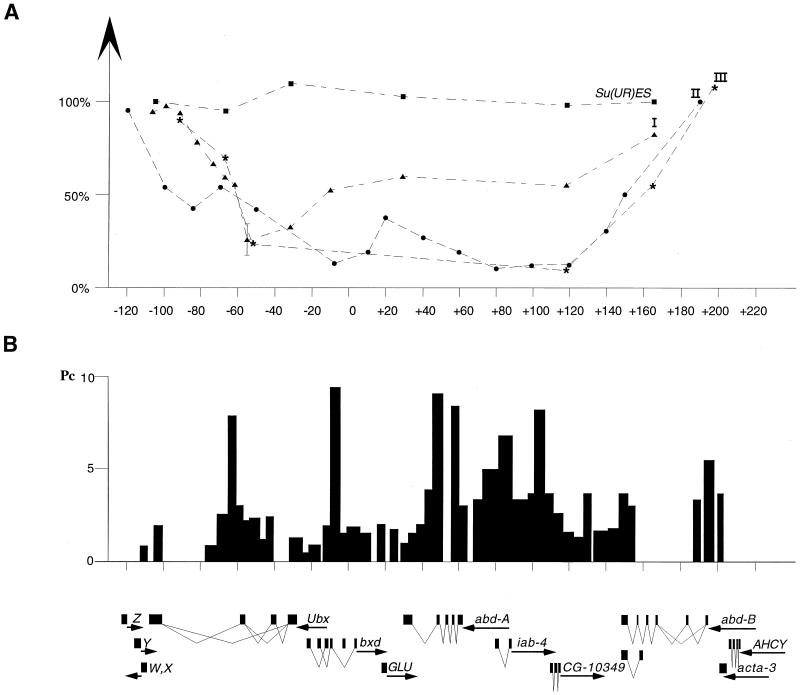
Figure 2.
Profile of underreplication and organization of chromosome region containing the Bithorax Complex. (A) Relative level of DNA replication of the BX-C in salivary gland cells in wild-type and Su(UR)ES strains. Triangles represent data obtained from wild type in experiment I (Fig. 1 and Table 1). Dots represent data of experiment II. Asterisks represent experiment III (Fig. 1 and Table 1). Squares represent data for Su(UR)ES strain (Fig. 1 and Table 1). (B) Distribution of Polycomb protein (bars) through the BX-C in the cell culture (19). Transcription units in the region taken from ref. 29 are delineated at the bottom.

