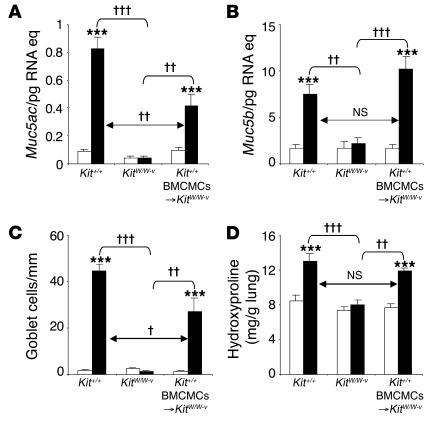
Figure 5. Airway goblet cell numbers and mucin gene expression in this chronic asthma model 24 hours after the ninth OVA or PBS challenge.
(A and B) Lung mRNA levels of genes encoding mucin 5AC and mucin 5B. (C) Numbers of goblet cells along the airway epithelium. (D) Levels of lung hydroxyproline. White bars, PBS-treated group; black bars, OVA-sensitized/challenged group. ***P < 0.001 versus corresponding PBS controls; †P < 0.05, ††P < 0.01, or †††P < 0.001 versus group indicated. n = 6 per group (A–C); n = 8 per group (D).

