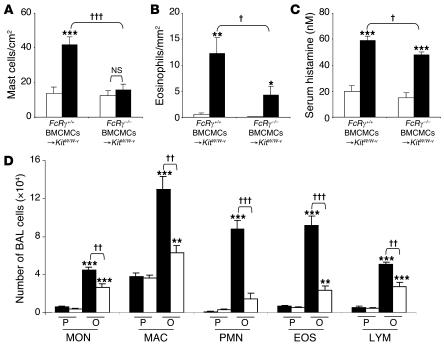
Figure 7. Features of allergic inflammation in this chronic asthma model 24 hours after the ninth OVA or PBS challenge inFcRγ–/– BMCMCs→KitW/W-v mice versusFcRγ+/+ BMCMCs→KitW/W-v mice.
(A and B) Numbers of lung MCs (A) and eosinophils (B). (C) Serum histamine concentration. (A–C) White bars, PBS-treated group; black bars, OVA-sensitized/challenged group. (D) Numbers of leukocytes in BAL fluid from the right lungs of FcRγ+/+ BMCMCs→KitW/W-v (black bars) and FcRγ–/– BMCMCs→KitW/W-v (white bars) mice. **P < 0.01 or ***P < 0.001 versus corresponding PBS controls; †P < 0.05, ††P < 0.01, or †††P < 0.001 versus group indicated (n = 6 per group).

