
Figure 2.
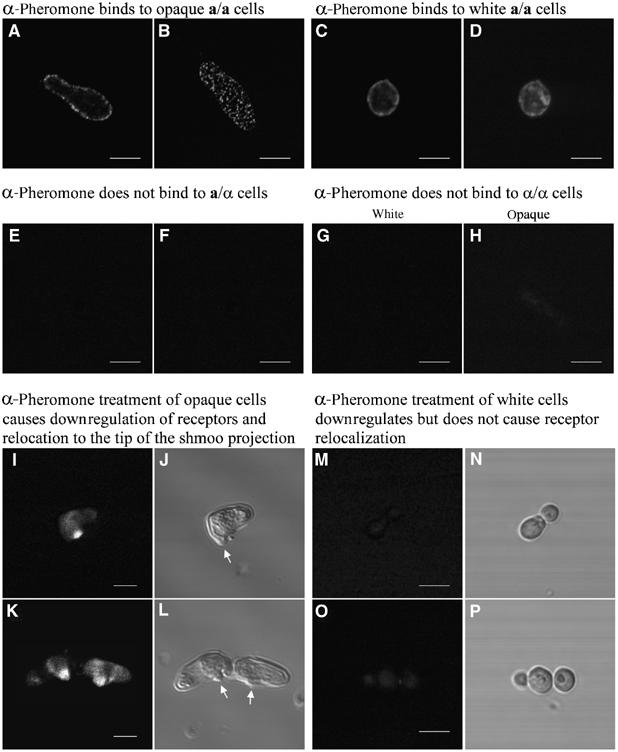
White a/a cells express α-pheromone receptors on their surface, but the distribution prior to pheromone treatment and the redistribution after pheromone treatment differ from that of opaque cells. Live white or opaque cells were treated with biotinylated α-pheromone on ice, fixed, and stained with Oregon Green® streptavadin to assess receptor distribution. (A, B) Punctate staining pattern of opaque cells visualized by LSCM 1 μm above the substratum or at the substratum, respectively. (C, D) Uniform staining pattern of white cells visualized by LSCM 1 μm above the substratum or at the substratum, respectively. (E, F) α-Pheromone does not label a/α cells. (G, H) α-Pheromone does not stain white or opaque α/α cells, respectively. (I–L) α-Pheromone treatment of opaque a/a cells leads to downregulation and relocalization of receptors to the site of conjugation tube evagination in the shmoo. (M–P) α-Pheromone treatment of white a/a cells leads to downregulation, but not to relocalization, of receptors. Arrows in (J, L) denote conjugation tube evaginations. Scale bars, 2 μm.