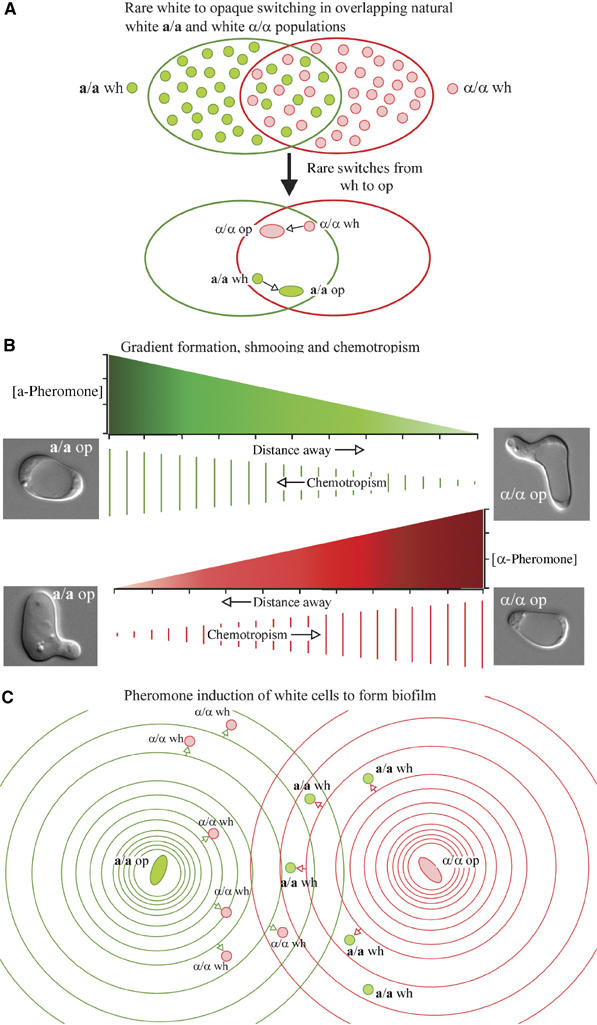
Figure 3.

Developing the hypothesis that opaque cells signal white cells of opposite mating type, through the release of pheromone, to form a biofilm that protects the opposing spatial gradients of pheromone that must develop for chemotropism to proceed. (A) In overlapping populations of natural white a/a and white α/α cells in the host, the predominant phenotype is white, but there are rare and transient switches from white to opaque. (B) An opaque a/a cell releases a-pheromone, which forms a spatial gradient that induces shmooing and promotes chemotropism of an opaque α/α cell, and vice versa. The spatial gradients of opposing pheromones are diagrammed between an opaque a/a and opaque α/α cell both as a graph of concentration as a function of distance (green and red, respectively) and as a sequence of parallel lines decreasing in length as concentration decreases. (C) The a-pheromone released by the rare opaque a/a cell and the α-pheromone released by the rare opaque α/α cell promote biofilm formation in white cells of opposite mating type. The spatial gradients of opposing pheromones are diagrammed as rings separated by greater distances denoting concentration decreases. Small arrows represent pheromone induction of white cells of opposite mating type to join in biofilm formation.wh, white; op, opaque.
