
Figure 2.
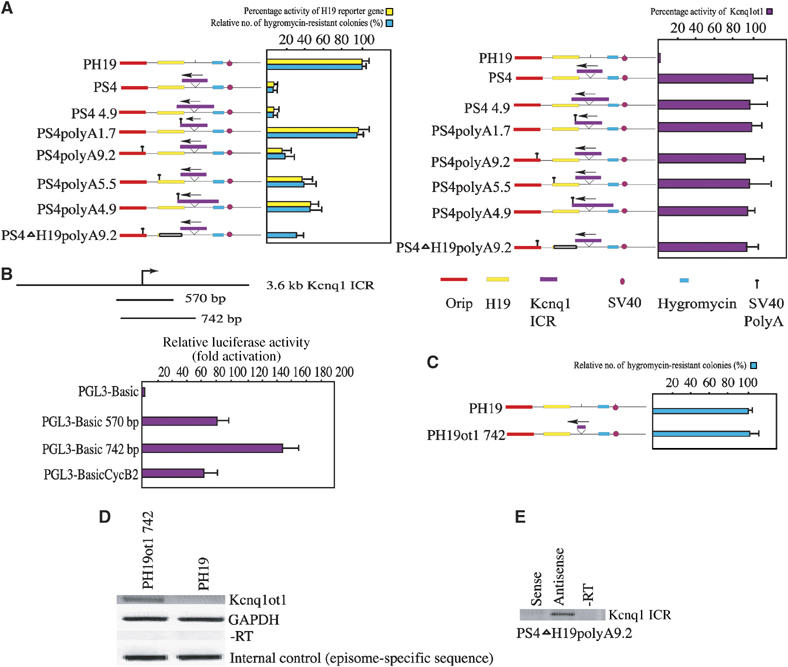
The length of the antisense transcript determines the degree of bidirectional silencing. (A) The left panel contains a bar graph showing the activity of the H19 and hygromycin genes in various episomal constructs, as depicted beside the bar graph. For each construct, the activity of H19 is represented by yellow bars and that of hygromycin by green bars. The activity of each reporter gene is represented as percentage expression levels. The activity of the control vectors (PH19 for H19 and hygromycin genes) were, for convenience, assigned a value of 100% and the values obtained with mutant episomal plasmids were related to this value. The activity of H19 reporter gene was quantified by RPA using RNA obtained from JEG-3 cells harvested 8 days after transient transfection with episomes. Percentages of expression levels were calculated after normalization against total input RNA, using GAPDH mRNA as an internal standard, and episomal copy numbers, quantified by Southern hybridization of DNA obtained from transfected cells probed with both an episome-specific probe and an internal control probe, PDGF gene. The number of hygromycin-resistant clones (green bars) was used to assess bidirectional silencing by the Kcnq1 ICR. The right panel depicts a bar graph showing the expression levels of the antisense transcript in various PolyA constructs, in relation to the control construct PS4. The percentage expression levels for the antisense transcript activity were calculated as described above. The data represent the means±s.d. of three independent experiments. (B) Functional mapping of the Kcnq1ot1 antisense promoter within the Kcnq1 ICR. Cartoon showing the fragments of the Kcnq1 ICR that were cloned into promoter-less luciferase vector (PGL3-Basic). The bar graph shows the relative luciferase activity. The strength of the promoter activity of PGL3-Basic570 and PGL3-Basic742 is presented relative to PGL3-BasicCycB2. All of the luciferase constructs were transfected into JEG-3 cell line. The data represent means±s.d. of three independent experiments performed in duplicate. (C) The 742 bp fragment encompassing the Kcnq1ot1 antisense promoter does not show any bidirectional silencing activity. The graph shows the hygromycin gene activity in PH19ot1 742 relative to the control PH19 plasmid. The data represent means±s.d. of three independent experiments. (D) RT–PCR assay shows that the 742 bp fragment encodes the antisense transcript in PH19ot1 742 episome construct. The RT–PCR was performed using the H19pro primers (see Figure 1B for primer details). (E) Strand-specific RT–PCR, performed using the Kcnq1ot1 primers (see Figure 1B for primer details), shows the presence of the antisense transcript in the Kcnq1 ICR region, but not the presence of any transcript encoded from the episomal sequences.