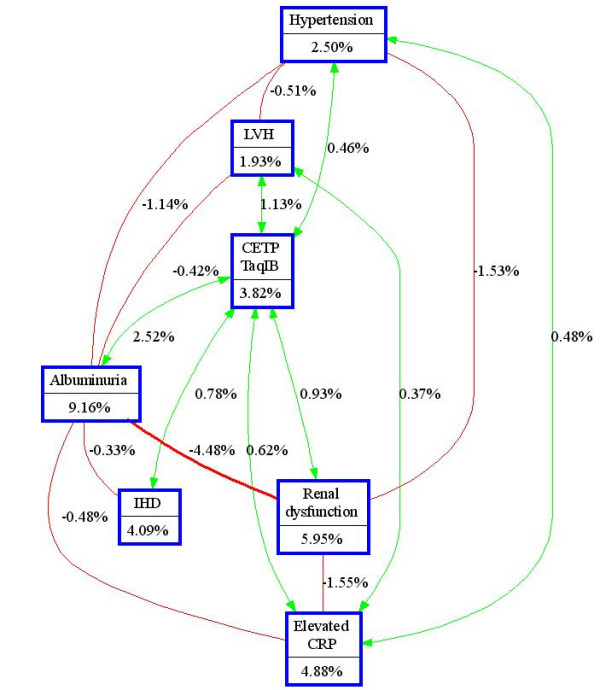
Figure 2.

Interaction entropy graph. The interaction models illustrated in the interaction graph describe the percent of the entropy in case-control status (i.e. presence of atrial fibrillation) that is explained by each factor or two way interaction. Each gene or environmental factor is shown in a box with the percent of entropy below the label. Two way interactions between factors are depicted as an arrow accompanied by a percent of entropy explained by that interaction. Redundancy is depicted as a line between factors accompanied by a negative percent of entropy. LVH: Left ventricular hypertrophy. IHD: Ischemic heart disease. CRP: C-reactive protein.
