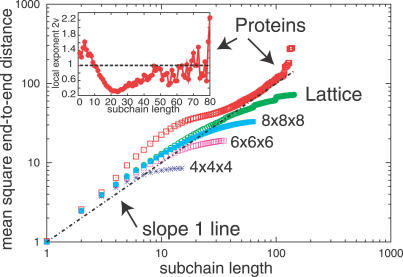
Figure 1. Data for the Mean Square End-to-End Distance of Subchains of Proteins (Squares) and Compact Lattice Loops (Circles) Plotted against the Subchain Length in a log–log Scale.
The mean square end-to-end distance of subchains for compact lattice loops of sizes 4 × 4 × 4, 6 × 6 × 6, and 8 × 8 × 8 also are shown to illustrate saturation at different loop sizes. For each chain of length N, subchains of length up to N 2/3 contribute to the average. The dashed line corresponds to a random walk behavior 〈R 2(ℓ)〉 = ℓ. The mean square end-to-end distance in Å2 for proteins has been divided by the factor (3.8)2. The data for proteins is similar to that in Figure 2 of [14]. (In that work, the end-to-end distance instead of the square of the end-to-end distance is plotted). The inset at the upper left shows the local scaling exponent 2ν, where 〈R 2(ℓ)〉 ∼ ℓ 2ν, plotted against subchain length (up to 80 residues) for proteins. 2ν was calculated from two adjacent protein data points at ℓ 1 and ℓ 2 via 2ν = log [〈R 2(ℓ 2)〉/〈R 2(ℓ 1)〉]/log(ℓ 2 /ℓ 1). The horizontal dashed line in the inset represents the exponent 2ν = 1.

