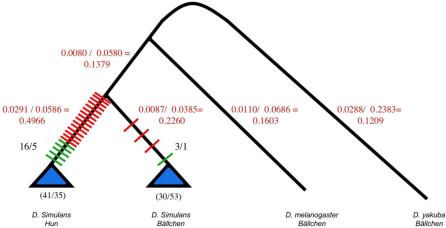
Figure 4. Gene Tree for D. simulans Hun and D. simulans, D. melanogaster, and D. yakuba's Bällchen .
The tree includes measurements of divergence as measured by Ka/Ks (red ratios), nonsynonymous and synonymous fixations found along the Hun and Bällchen branches depicted by colored bars (red represents nonsynonymous changes and green represents synonymous changes, black ratio), and polymorphisms found in the D. simulans population data (black ratios below triangles, nonsynonymous/synonymous). The low divergence estimates suggest that all genes are constrained. The most notable feature of the tree is the significant excess of nonsynonymous substitutions along Hun's branch. This excess was detected by McDonald-Kreitman tests, and is significantly different than that of the pooled Bällchen and Hun data, and marginally significantly different than that of the Hun-only data (see Table 2).

