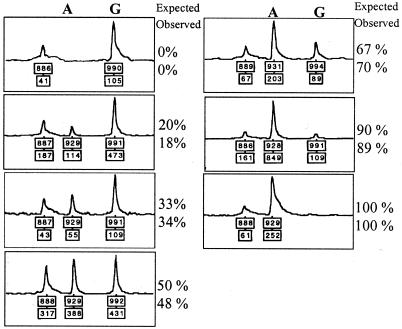
Figure 1.
Evaluation of fluorescent SNuPE assays with insert sequences displaying A and G at the IGF polymorphism in serial mixtures of two plasmids. The A plasmid containing the A allele of the IGF2 A/G polymorphism and the G plasmid containing the G allele were mixed in known proportions as indicated. The mixtures were subjected to nested PCR and SNuPE assay. The chromatograms showed three fluorescent peaks. The peak at the left at 23 bp is 6-carboxyfluorescein-primer, the peak at 26 bp is the primer extension product from the A allele, and the peak at 31 bp is the primer extension product from the G allele. The expected values of A/(A + G), expressed as a percentage, are compared with those observed by SNuPE assay.

