
Fig. 2.
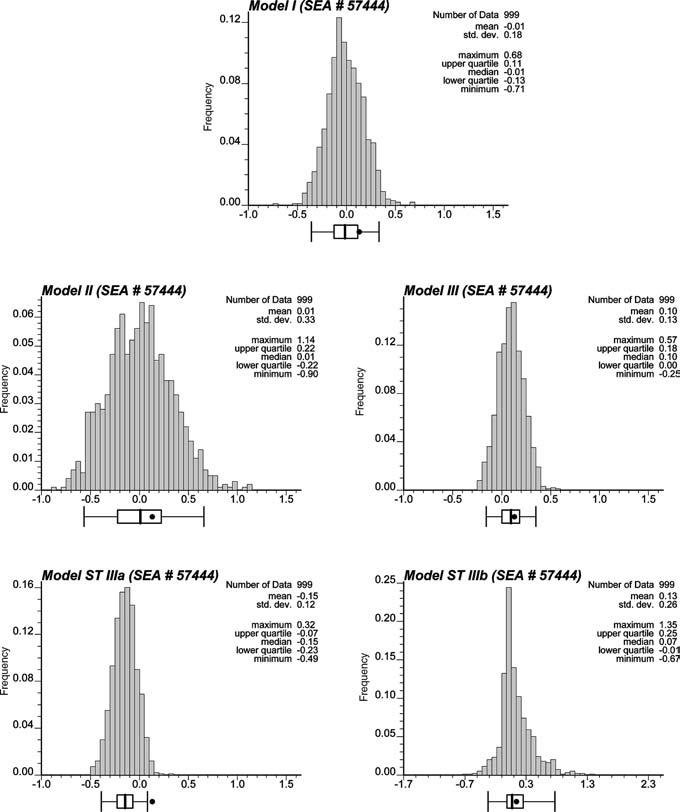
Histograms of the values of the LISA statistic simulated for SEA unit # 57444 (Del Rio, Texas) under different neutral models. The black dot denotes the observed LISA statistic which lies inside the 0.95 probability interval for all models except the space-time model using LISA statistic (8)