
Fig. 3.
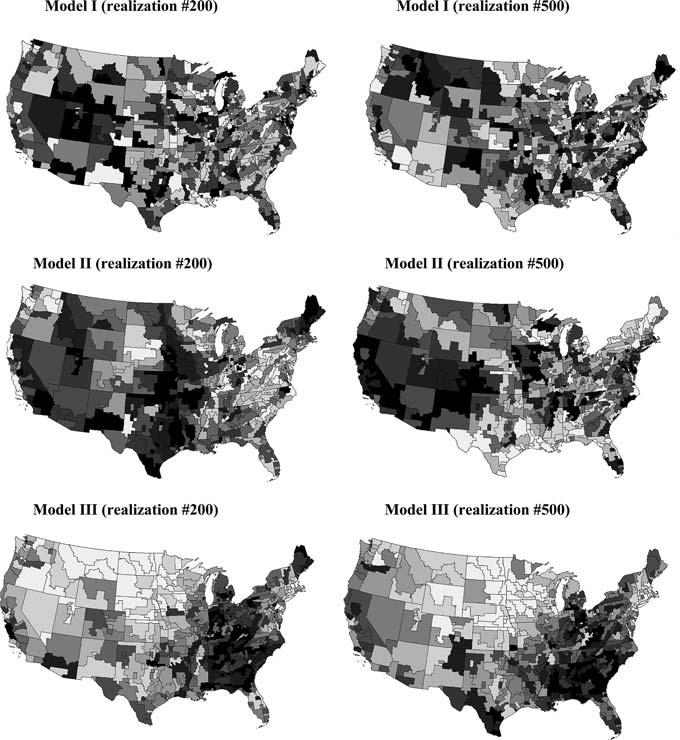
Two realizations of the spatial distribution of cervix cancer mortality data based on the assumption of spatial independence (Model I), reproduction of spatial autocorrelation (Model II), and incorporation of the regional background displayed in Fig. 4 (Model III). The grayscale ranges from white (low rates) to black (high rates), and for each realization categories correspond to deciles of the histogram of simulated rates