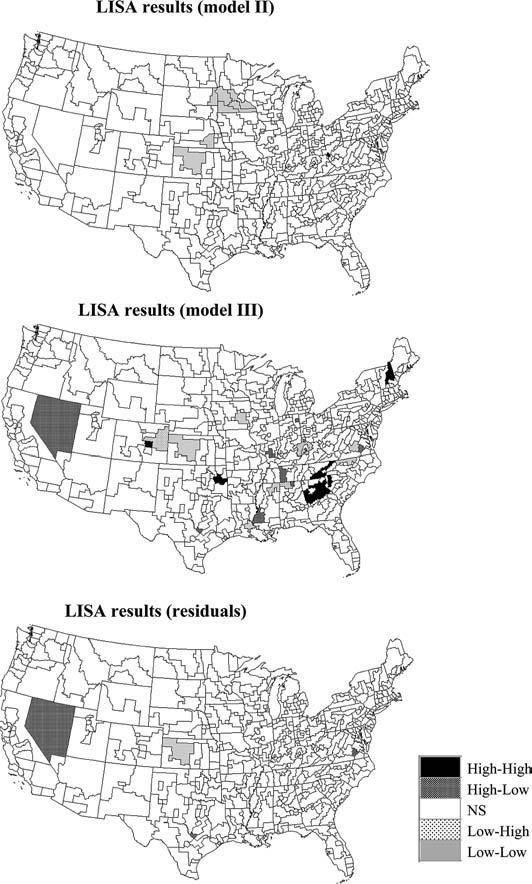
Fig. 5.

Results of the local cluster analysis conducted using spatially correlated null models of the type displayed in Fig. 3 (Models II and III). For comparison purposes the bottom graph shows the results of the analysis for the map of residuals displayed in Fig. 4 using a neutral model of type II to account for the spatial autocorrelation of the residuals
