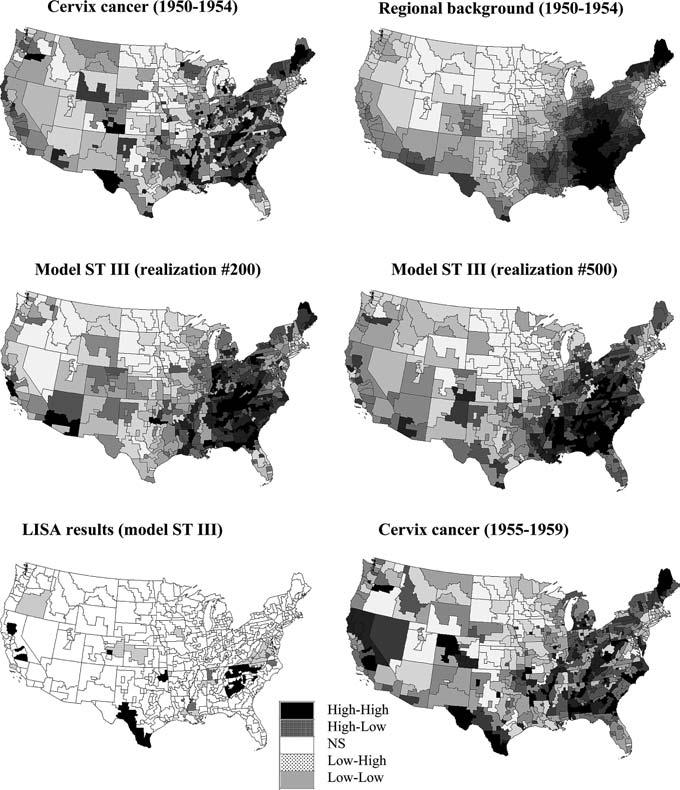
Fig. 6.

Maps of cervix cancer data for the period 1950–1954 and the regional background obtained by geostatistical smoothing of the short-range variability (top graphs). This regional background is used to generate the two realizations of the neutral model ST III (middle graphs). Bottom maps show the results of the local cluster analysis under this new model, and the distribution of cervix cancer mortality data for the tested period of 1955–1959. For all continuous variables grayscale categories correspond to deciles of the histogram of displayed values
