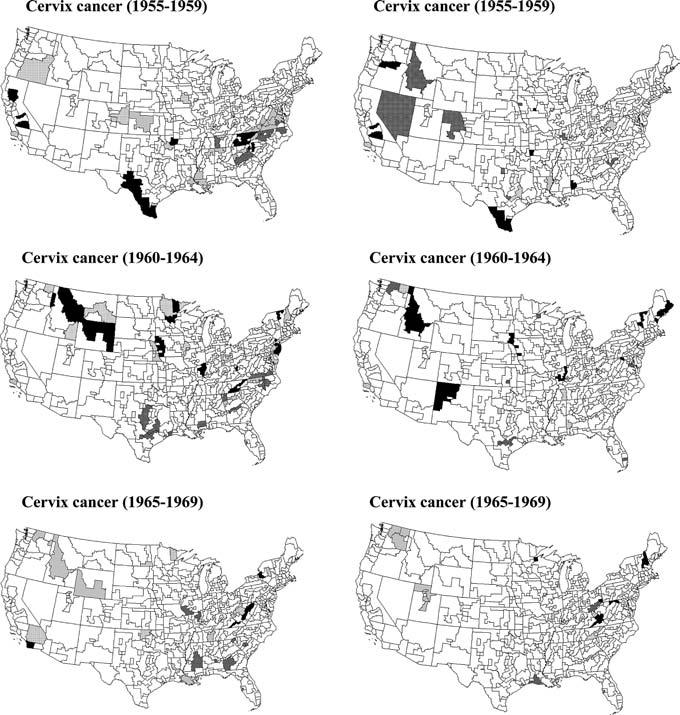
Fig. 7.

Results of the local cluster analysis under the ST III neutral model for the cervix cancer mortality rates recorded for a series of time periods. Left column corresponds to statistic (8), while right column results are produced by statistic (9)
