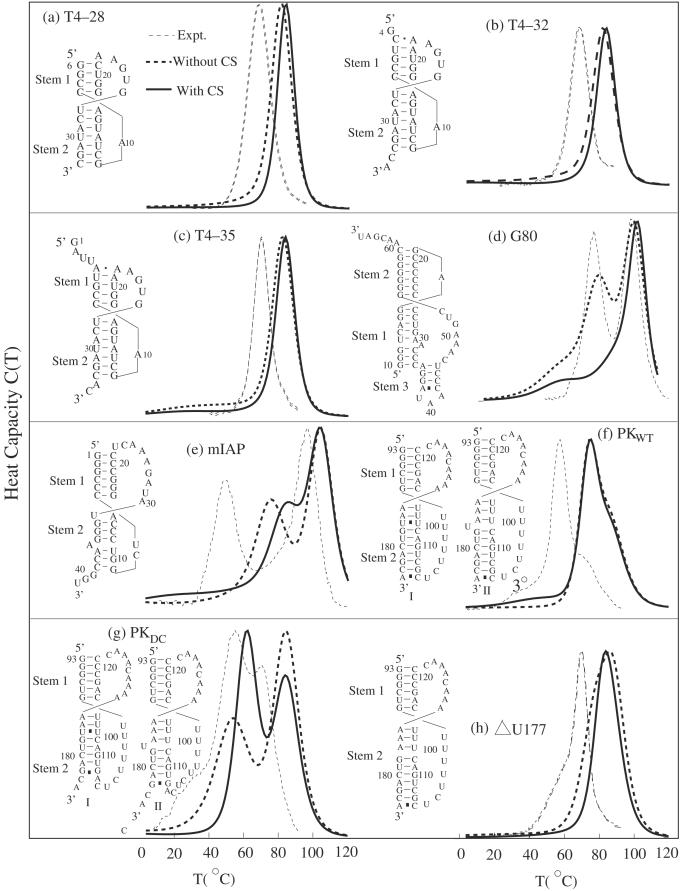
Figure 6.
The comparison between the calculated melting curves and the experimentally measured results for eight pseudoknots sequences (a) T4–28, (b) T4–32, (c) T4–35 (24,26), (d) G80 (23), (e) mIAP (27), (f) the telomerase pseudoknot domain (PKWT), (g) (28) and (h) (29) are two mutants of the telomerase pseudoknot domain. The Y-axis is the heat capacity. The calculated melting curves have been normalized such that the theoretical and the experimental curves have the same peak value. The ion conditions are 50 mM NaCl and 1.0 mM Mg2+ for (a), (b) and (c), 1 M KCl for (d), 50 mM KCl for (e), 200 mM KCl for (f), (g) and 200 mM NaCl for (h). Because our calculated enthalpic and entropic parameters for the base stacks are from Turner's rules for 1 M NaCl salt condition, our model generally overestimates the melting temperatures. Results with and without coaxial stacking (CS) are both presented.

