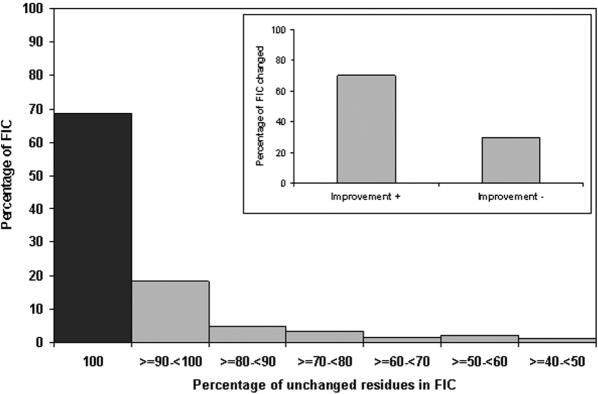
Figure 6.
Quality control by testing the recovery of FIC. Alignments of FICs are compared before and after the refinement. The automated refinement procedure could reproduce the exact same alignment that was obtained by careful manual curation for most (shown by black box) of the FICs. In addition, majority of the changed FICs show better score (inset, improvement+) when compared against the score derived before the refinement.

