
FIG. 4.
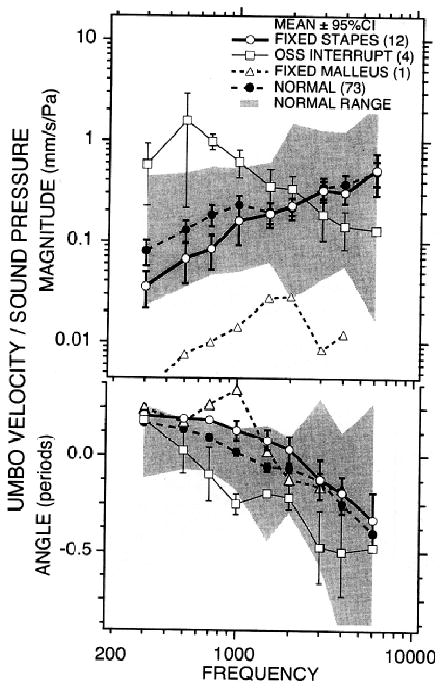
Comparison of the means and variance of the patient groups with the normal group. The four curves in each panel represent the mean magnitude and angle in four measurements groups: normal ears (n = 73), fixed stapes (n = 12), ossicular interruption (n = 4) and fixed malleus (n = 1). The shaded area shows the range of the normal measurements. The bars are the 95% confidence limits (1.95 times the standard error of the mean) about the means. Small or no overlaps between the means and confidence limits indicate significant differences between the populations.