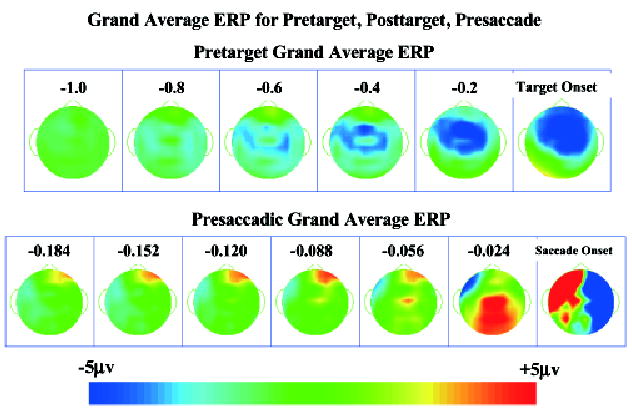
Figure 1.

Topographical scalp potential maps for the grand average ERP in the pretarget period and immediately preceding the saccade, collapsed across conditions. The pretarget map is plotted as the average for 200-ms intervals from 1 s until target onset. The presaccade map is plotted as 32-ms averages from 182 ms preceding the saccade through 40 ms following saccade onset. For all topographical maps, the stimulus-locked segments are positioned so that the target appeared on the left side and the response-locked segments are positioned so that the eye movement went toward the left side.
