
Figure 3.
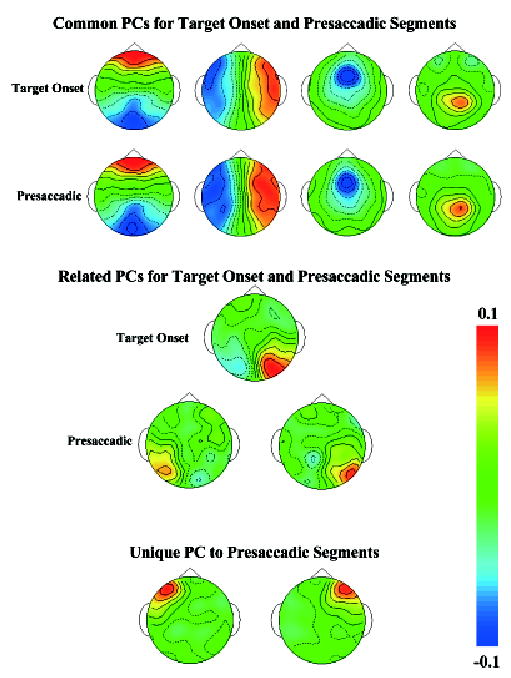
Topographical scalp potential maps for the average of the PC clusters (collapsed across conditions). The top two panels show clusters that were nearly identical in the stimulus-locked and response-locked EEG segments. The bottom panels show clusters that were unique in these periods. The eigenvector weights of the PC are plotted.