
Figure 9.
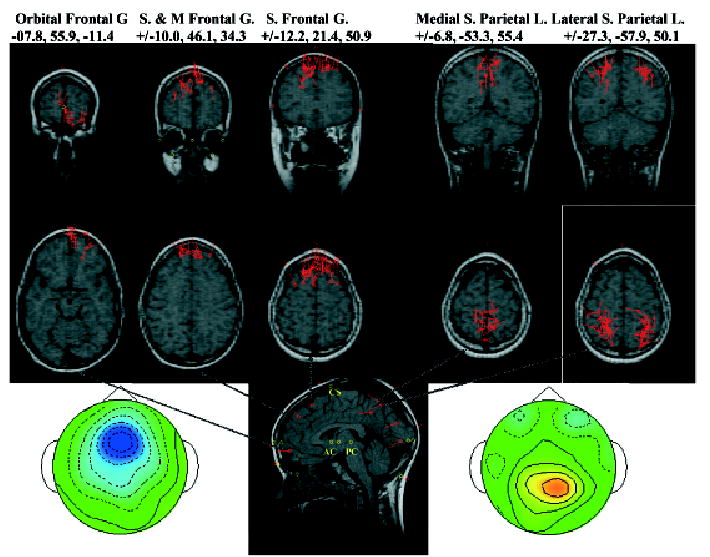
Equivalent current dipole locations for the pretarget PC clusters. Each location on the MRI recording represents a PC from one individual. The three MRIs on the left came from the negative frontal-central activity and the two on the right from the positive parietal activity. More information about the locations may be found in Table 2.