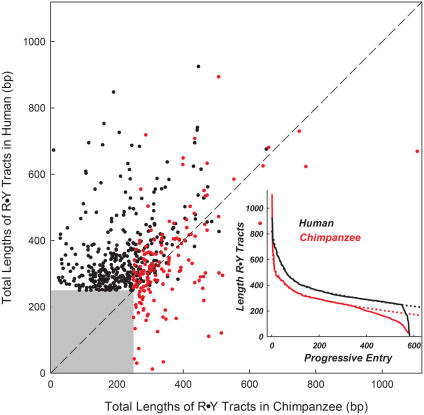
Figure 6.
Length comparison of R•Y tracts between human and chimpanzee. The lengths of the tracts in chimpanzee are plotted against the lengths of the orthologous tracts in human. The total R•Y tract lengths are given, including interruptions. Black dots, human pure R•Y tracts ≥250 bp in length versus orthologous tracts in chimpanzee (436 total); red dots, chimpanzee pure R•Y tracts ≥250 bp in length versus orthologous tracts in human (166 total). Inset, the 582 unique human/chimpanzee pairs of R•Y tracts from the main panel were ranked by length. Black line, human R•Y tracts (average length = 359 ± 114 bp); red line, chimpanzee R•Y tracts (average length = 260 ± 127 bp); dotted lines, curves fitted to the distributions of R•Y tracts.

