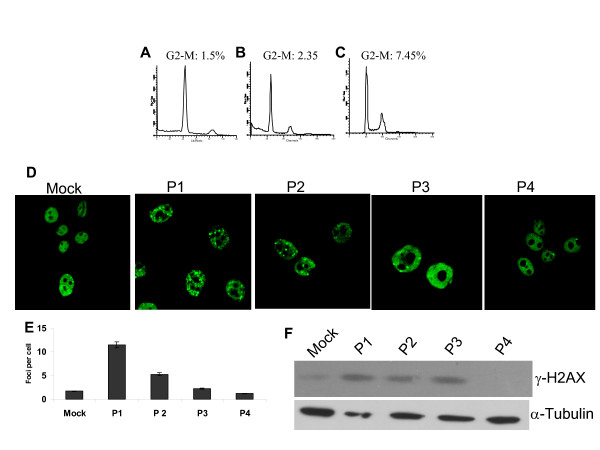
Figure 3.
Cell cycle and DNA damage response analysis of RC-L1-expressing cells. MCF-7 cells either Mock transfected, expressing GFP or RC-L1 were analyzed by FACS as described under "Experimental Procedures". The histograms represent the distribution of cells through the cell cycle measured by flow cytometry and analyzed with ModFit. (A) untransfected MCF-7 cells. (B) MCF-7 cells transfected with EGFP (C) MCF-7 cells transfected with RC-L1. The percentage of cells in G2 or M is shown for each treatment group. Detection of the induction of γ-H2AX foci formation using anti-γ-H2AX polyclonal antibody. (D) by immunostaining of Mock transfected cells and serially passaged RC-L1-expressing cells (P1-P4) (E) Number of γ-H2AX foci in four different cell passages, P1-P4. Error bars show s.d. (F). Expression level of γ-H2AX determined by immunoblotting.

