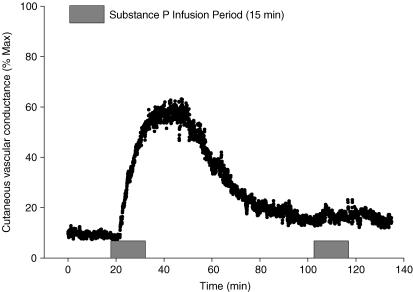
Figure 2. Representative tracing of the skin blood flow response to the first and second substance P infusions.
Tracing is from a 20 μm control site from one subject. Note the lack of an increase in cutaneous vascular conductance response (CVC) in response to a second 20 μm substance P infusion. Grey box indicates substance P infusion period.

