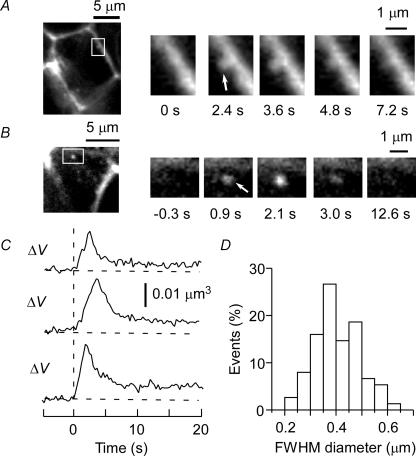
Figure 2. Two-photon excitation imaging of exocytosis in pancreatic islets.
A and B, two examples of imaging of exocytosis with SRB. Full flattening of a vesicle (arrow) is apparent in the side view (A), whereas an exocytic event (arrow) is clearer in the front view (B) because of the reduced level of background fluorescence attributable to the horizontal and narrow intercellular space. The boxed regions in the large panels on the left are shown at higher magnification in the smaller panels. C, time courses of fluorescence during single exocytic events. The top and middle traces correspond to the events shown in A and B, respectively. ΔV represents the volume of the fluorescence profiles of exocytic vesicles calculated on the basis of the ΔV-TEPIQ analysis. D, histogram of FWHM diameters of exocytic vesicles (n = 75).

