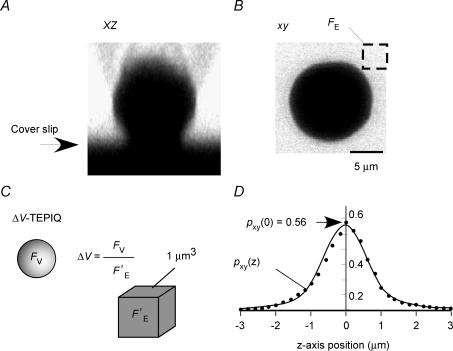
Figure 3. TEPIQ analysis of ΔV.
A and B, fluorescence images (xz and xy, respectively) of a single β-cell on a cover slip immersed in a solution containing SRB (0.4 mm). C, the volume of an exocytic vesicle is estimated from the SRB fluorescence intensities for an exocytic event (FV) and for a unit volume of extracellular solution (F′E). D, an actual point spread function for a quantum dot (diameter of 5 nm) along the z-axis (•). The fluorescence intensity was normalized so that the total integral became 1.0. The smooth line is predicted by eqn (A17) in Appendix C.

