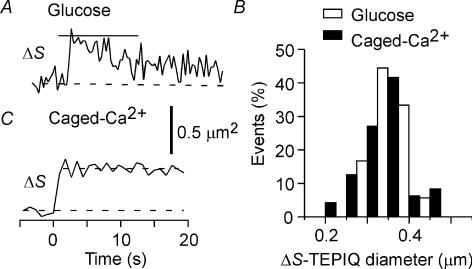
Figure 6. TEPIQ analysis of ΔS for exocytosis in pancreatic islets.
A and C, time courses of ΔS based on FM1-43 fluorescence for single exocytic events induced by glucose stimulation (A) or by uncaging of NPE (C). B, histograms of vesicle diameter obtained by ΔS-TEPIQ analysis of exocytosis induced by glucose (open bars, n = 36) or by uncaging of NPE (filled bars, n = 48).

